- Tech Savvy Starts Here
- Posts
- Learning with Your Eyes — How AI Chatbots Support Visual Learners
Learning with Your Eyes — How AI Chatbots Support Visual Learners
How Visual Learners Can Use AI Chatbots to Master Any Topic.

Hello Techies,
✨ Do flowcharts, colour-coded notes, and diagrams help everything make sense?
If so, you might be a visual learner—and AI chatbots can help you unlock your full potential with the power of visual structure.
Let us explore how visual learners can make the most of modern AI tools and prompts.
🔍 What Is a Visual Learner?
Visual learners prefer to take in information through images, spatial relationships, and visual structure. Rather than just reading or listening, they “see” knowledge.
Common signs that you are a visual learner:
You highlight, underline, or draw while studying
You prefer diagrams, charts, and illustrations
You remember where something is on a page or screen
You struggle with unstructured text or dense lectures
If you find that visualizing a concept helps you understand it faster, you are not alone. Visual processing is one of the brain’s most efficient learning systems.
🤖 How AI Chatbots Can Help Visual Learners
While AI chatbots like ChatGPT and MetaAI are text-based at their core, they can organize and generate content visually—especially when you ask the right way.
1. Generate Charts, Tables, and Diagrams
You can prompt the AI chatbot to structure information using comparison tables, step-by-step flowcharts, or category lists. For example:
Prompt: Compare neural networks and decision trees in a table with pros and cons.
2. Structure Notes Visually
You can ask your chatbot to format information with headings, bullets, and callouts that are easier to scan and memorize. For example:
Prompt: Break down the causes of natural disasters using categories, subheadings, and short paragraphs.
3. Create Visual Outlines and Concept Maps
While some chatbots can not draw, they can structure content to be imported into tools like Miro, Notion, Canva, or Lucidchart.
Other chatbots like ChatGPT, Claude can be prompted to provide a visual outline or concept map to aid understanding. For example:
Prompt: Give me an outline for a mind map on human anatomy.

Mind map for human anatomy generated using ChatGPT.
4. Recommend Visual Resources
You can ask for video demos, animations, or infographics that deepen your understanding through image and motion. For example:
Prompt: Find a YouTube video that visually explains the periodic table.
💡 Real-Life Example
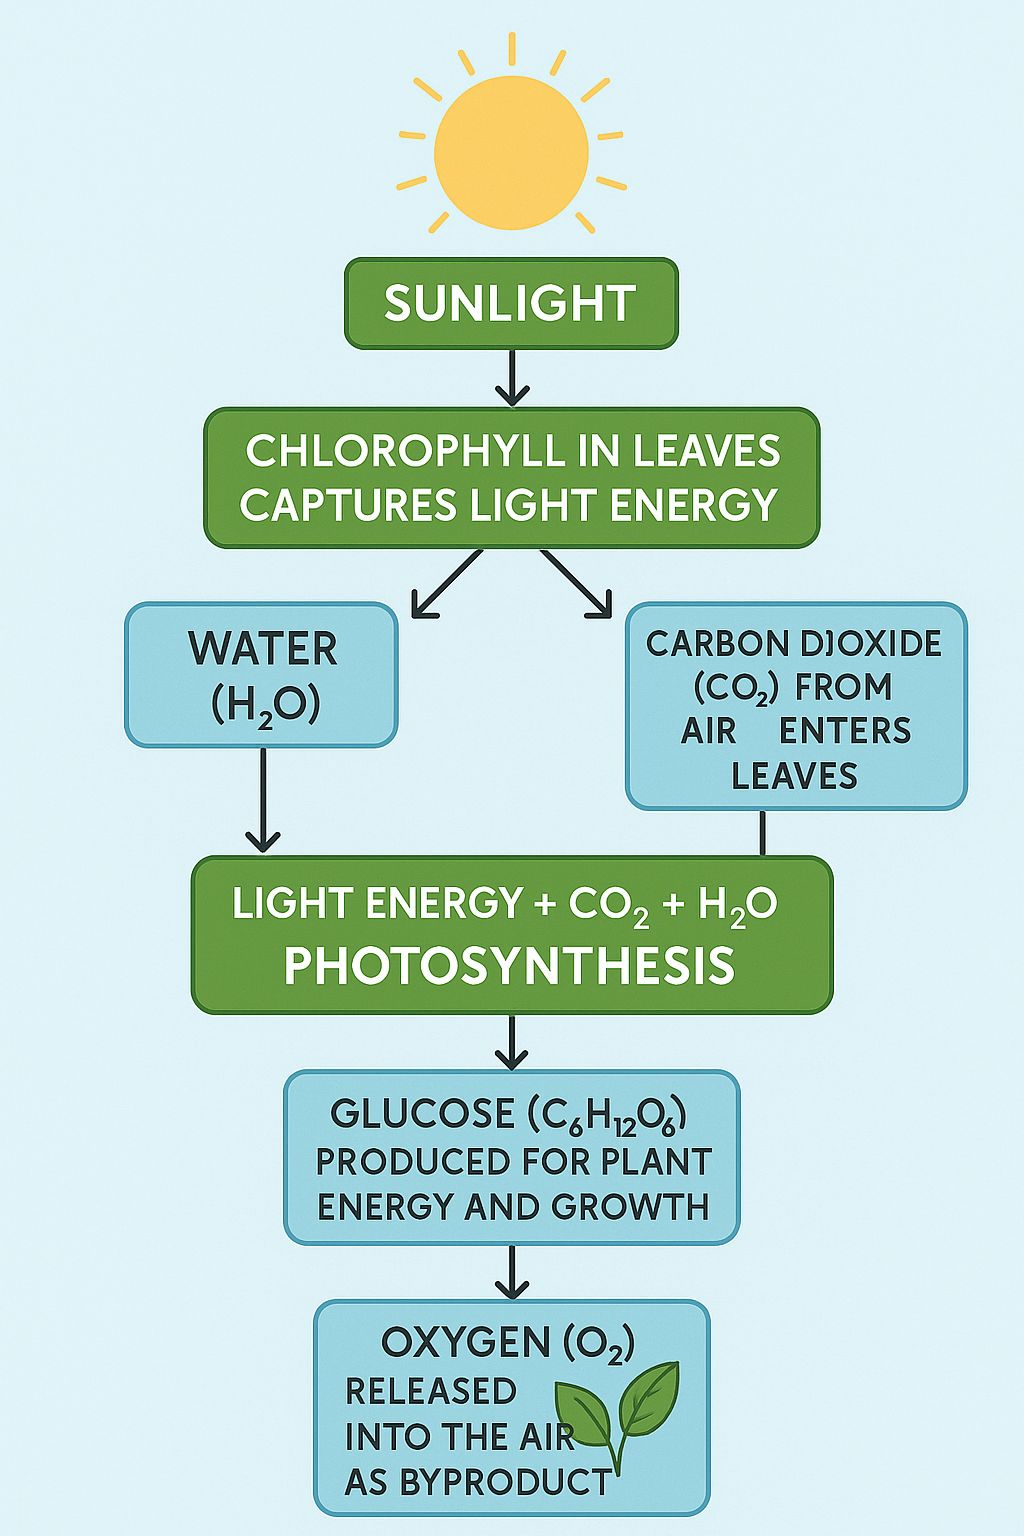
Let us say that you are learning about photosynthesis, you can ask:
Prompt: Can you explain photosynthesis using a flowchart format? Include a visual diagram.
Here is a sample of ChatGPT’s response to the prompt:

Visual diagram of photosynthesis in flowchart format made using ChatGPT
Now, you can save this visual diagram or even turn it into a flashcard so you can retain the knowledge better.
Or let us say that you are prepping for a presentation, you can ask:
Prompt: Give me a slide-friendly bullet breakdown of Newton’s Laws with icons I could add.
The chatbot outlines it clearly—perfect for visual delivery as shown below:
⚖️ Newton’s First Law – Law of Inertia
Statement: An object at rest stays at rest, and an object in motion stays in motion at a constant velocity, unless acted on by an external force.
Key Idea: Things keep doing what they’re doing—unless something makes them change.
Icon Suggestion: 🚗🛑 (car with stop sign) or 🧍♂️➖➡️ (person standing still, unpushed)
💥 Newton’s Second Law – Law of Acceleration
Statement: Force = Mass × Acceleration (F = ma)
Key Idea: The greater the force, the greater the acceleration. The more massive the object, the more force needed.
Icon Suggestion: 🏋️♀️📈 (lifting weight with chart arrow), ⚖️🔁 (scales showing balance and change)
🔄 Newton’s Third Law – Action-Reaction Law
Statement: For every action, there is an equal and opposite reaction.
Key Idea: Push something, and it pushes back with equal force.
Icon Suggestion: 🎾↔️🎾 (bouncing ball hitting wall), 🚀🔥⬅️➡️ (rocket pushing down, moving up)
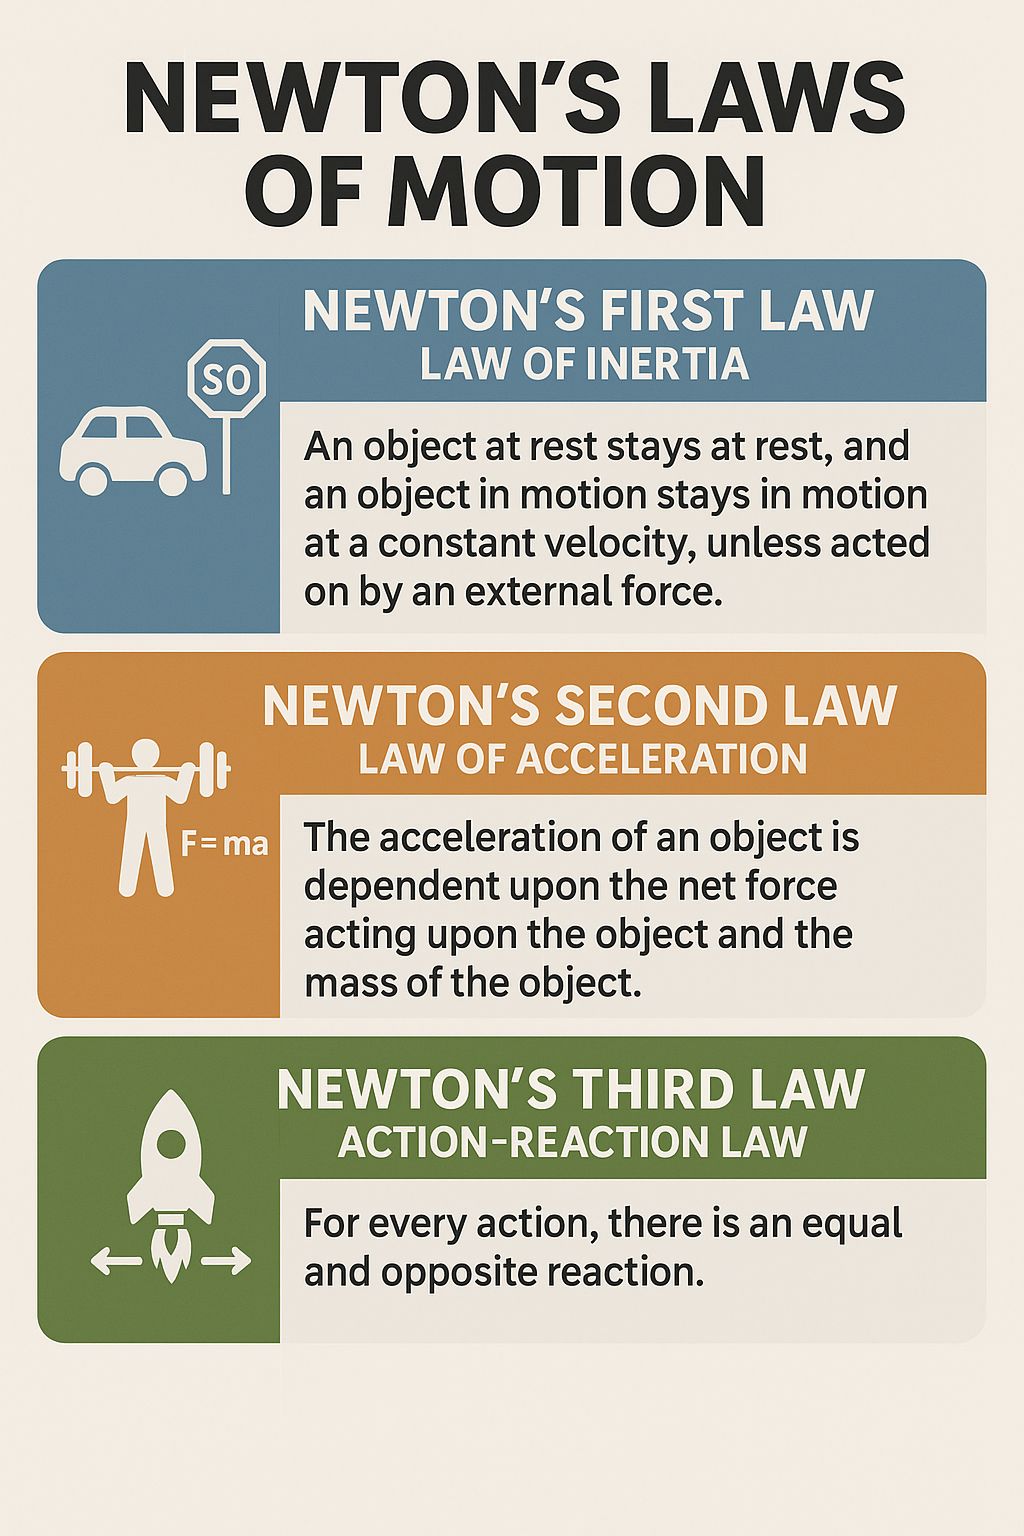
You can also ask for an infographic based on some text information that you have prepared like so:
Prompt: Create an infographic using the following information: [text information].

Sample Infographic of Newton’s Laws generated by ChatGPT
✅ 3 Practical Takeaways
1. Always Prompt for Format
Use phrases like: in a table, bullet summary, or as a diagram outline to structure responses visually.
2. Pair with Visual Tools
Ask the chatbot to create visuals for you or you can import the chatbot outputs into visual apps like Canva, Lucidchart, Whimsical, or Notion’s board view.
3. Color and Sketch It Out
Use chatbot responses as a base to highlight key ideas, draw illustrations, or group concepts by theme or colour.
📣 This Week’s Challenge
🎯 Pick a concept that you are currently learning and try this prompt:
Prompt: Create a mermaid diagram of [the topic that you are learning]
Take the output and paste it into the mermaid live editor to visualize and save diagram.
Alternatively, you can use the output to draw, visualize, or build on it using a tool like Canva or pen and paper.
Tag me @TechSavvyStartsHere or reply to this email—I would love to see your learning in action.
🔄 Coming Next: Auditory Learning + AI
In Week 2, we will look at how auditory learners can use AI chatbots to turn written content into conversations, podcasts, and spoken coaching sessions.
Enjoyed this edition?
Forward it to a friend or colleague who would enjoy it as well.
Missed something? Catch up in the newsletter archive.
🧠 Keep learning. | 💬 Keep questioning. | 💥 Keep growing.
Your Tech Partner,
Ijeoma Ndu, PhD